View from the Observation Deck
1. On 6/24/22, the S&P 500 Index closed the trading session at 3,911.74, which was 18.45% below its all-time closing high of 4,796.56 on 1/3/22, according to Bloomberg.
2. For the market to trend higher, we believe that corporate earnings will need to grow, and perhaps the best catalyst for growing earnings is to increase revenues.
3. From 1926-2021 (96 years), the S&P 500 Index posted an average annual total return of 10.5%, according to Morningstar/Ibbotson & Associates.
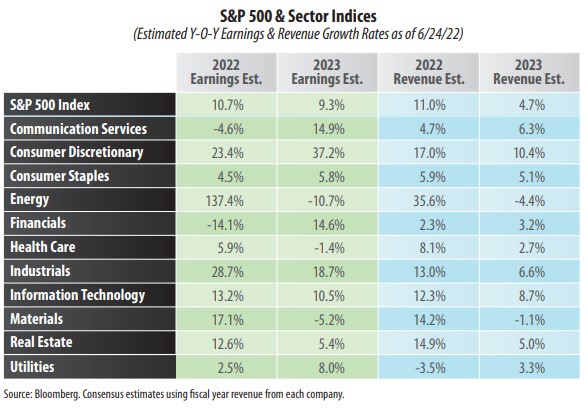
4. As indicated in the table, Bloomberg's 2022 and 2023 consensus year-over-year (y-o-y) earnings growth rate estimates for the index were 10.7% and 9.3%,
respectively, as of 6/24/22. They are roughly in line with the index's 10.5% average annual total return since 1926.
5. Six of the 11 major sectors that comprise the index reflect a positive double-digit or higher y-o-y earnings growth rate estimate for 2022, compared to five for 2023.
6. Bloomberg's 2022 and 2023 consensus y-o-y revenue growth rate estimates for the S&P 500 Index were 11.0% and 4.7%, respectively, as of 6/24/22.
7. Eight of the 11 major sectors reflect y-o-y revenue growth rate estimates of 5.0% or more for 2022, compared to six for 2023. For comparative purposes, from 2012- 2021, that 10-year average was 4.5%, according to S&P.
8. The following is a breakdown of the quarterly earnings growth rate estimates for the S&P 500 Index from Q2'22 through Q3'23 as of 6/24/22 (not in table): 4.3% (Q2'22); 10.3% (Q3'22); 10.8% (Q4'22); 10.0% (Q1'23); 10.8% (Q2'23); and 8.3% (Q3’22), according to Bloomberg.
9. Wall Street analysts remain optimistic about earnings growth in 2022 despite some significant economic headwinds. The optimism also extends to stock ratings. Data compiled by Bloomberg indicates that companies in the S&P 500 Index currently have an average consensus rating of 4, based on a scale of 1 (sell) to 5 (buy). That is the highest reading since 2002, according to its own release.


