View from the Observation Deck
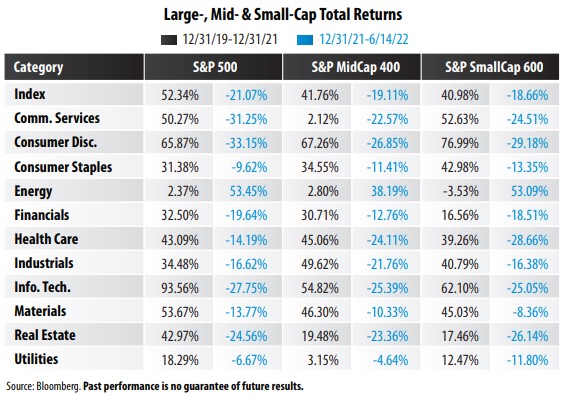
1. All three S&P stock indices in the table above recently shifted from correction mode into the bear market territory. The returns in blue ink reflect year-to-date total returns.
2. A correction is usually defined as a 10.00% to 19.99% decline in the price of a security or index from its most recent peak. A bear market is defined as a 20.00% or greater decline in the price of a security or index.
3. As of the close on 6/14/22, the S&P 500 Index stood 22.12% below its all-time closing high, according to Bloomberg. The S&P MidCap 400 and S&P SmallCap 600 Indices stood 21.53% and 22.68% below their respective all-time highs.
4. The three major indices featured in the table comprise the S&P Composite 1500 Index, which represents approximately 90% of total U.S. equity market capitalization (cap), according to S&P Dow Jones Indices.
5. Large-cap stocks performed significantly better than their mid-and small-cap counterparts from 2020-2021 (black columns). YTD through 6/14/22, large-caps have lagged the performance of both small- and mid-caps, (see table above). From 12/31/19 through 6/14/22 (the period covered in the table that captures the COVID19 pandemic), the S&P 500, S&P MidCap 400, and S&P SmallCap 600 Indices posted cumulative total returns of 20.29%, 14.75%, and 14.83%, respectively, according to Bloomberg.
6. Sector performance can vary widely by market cap (see table). A couple of the more extreme cases (2020-2021) include Information Technology, Real Estate, and Utilities. So far in 2022, it is Financials, Health Care and Utilities.
7. As of the close on 6/15/22, the percentage of stocks in the S&P 500, S&P MidCap 400, and S&P SmallCap 600 Indices trading above their 50-day moving averages were 5%, 10% and 17%, respectively.
8. The percentage of stocks in the S&P 500, S&P MidCap 400 and S&P SmallCap 600 Indices trading above their 200-day moving averages stood at 16% across the board.
9. Moving averages tend to smooth out day-to-day price fluctuations and can be a useful tool for traders and investors to identify both positive trends and reversals, in our opinion.


