View from the Observation Deck
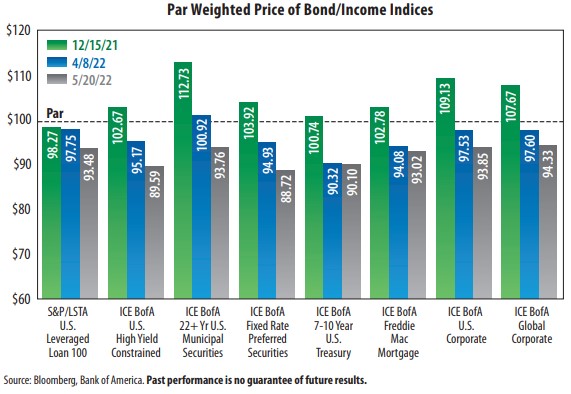
1. Today's blog post is one we do ongoing so that investors can monitor fluctuations in bond prices relative to changes in interest rates. The dates in the chart are from prior posts.
2. The Federal Reserve’s ("Fed") federal funds target rate (upper bound) stood at 1.00% on 5/20/22, according to data from the Fed. The Fed has signaled it will likely raise the benchmark lending rate by 50 basis points (bps) at each of its next two meetings (June & July), which would take it to 2.00%.
3. For the 30-year period ended 5/20/22, the federal funds target rate (upper bound) averaged 2.47% (essentially matching where it stood on 12/19/18), according to Bloomberg. It reached as high as 6.50% in May 2000.
4. The yield on the benchmark 10-year Treasury note (T-note) stood at 2.78% on 5/20/22, up from 1.46% on 12/15/21, according to Bloomberg. Its average yield was 3.97% for the 30-year period ended 5/20/22.
5. For comparative purposes, here were the closing yields for the indices featured in the chart as of 5/20/22: 5.99% (U.S. Leveraged Loan 100); 7.81% (U.S. High Yield Constrained); 4.50% (22+ Yr. Municipal Securities); 6.22% (Fixed Rate Preferred Securities); 2.78% (7-10 Yr. U.S. Treasury); 3.43%% (Freddie Mac Mortgage); 4.37% (U.S. Corporate ); and 3.78% (Global Corporate), according to Bloomberg.
6. While all of the major debt categories in the chart are down since 12/15/21, the most resilient to rising bond yields has been leveraged loans (senior loans).
7. The trailing 12-month Consumer Price Index (CPI) rate stood at 8.3% in April 2022, according to the Bureau of Labor Statistics. That is up nearly double from its 4.2% level in April 2021 and its 2.4% average rate over the past 30 years.
8. The yield on the 10-year T-note has topped the 3.00% mark a few times over the past decade, but not for long. Will this time be different? Stay tuned!


