View from the Observation Deck
1. The yield on the 10-year Treasury note (T-note) closed at an all-time low of 0.51% on 8/4/20, according to Bloomberg.
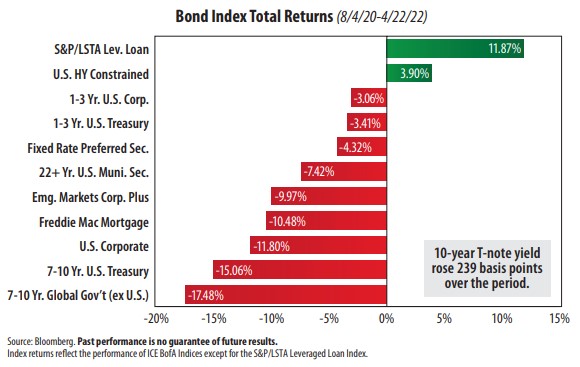
2. From 8/4/20 through 4/22/22, its yield rose from 0.51% to 2.90%, or an increase of 239 basis points, based on the close of trading. It reached as high as 2.94% on 4/19/22 during the period.
3. As indicated in the chart above, the worst-performing bond categories for the period all track high-grade debt.
4. Since 8/4/20, investors have favored speculative-grade bonds over investment-grade debt, as evidenced by the positive total returns posted by leverage loans (senior loans) and high yield corporate bonds.
5. Emerging market bonds and intermediate-term global government bonds were deep into negative territory for the period captured in the chart. The strength in the U.S. dollar definitely had a negative impact on the performance of foreign bonds, in our opinion. The U.S. Dollar Index (DXY) rose by 8.40% over the same period, according to Bloomberg.
6. Inflation has surged. The trailing 12-month CPI (Consumer Price Index) stood at 8.5% in March 2022, up from 2.6% a year earlier. The CPI is at a level not seen since 1982, according to data from the Bureau of Labor Statistics.
7. On 3/16/22, the Federal Reserve ("Fed") initiated a 25 basis point hike in the federal funds rate. Fed Chairman Jerome Powell commented on 4/21/22 that the Fed is committed to raising rates “expeditiously” to lower inflation, according to CNBC. The CME Group’s FedWatch Tool indicated that expectations for a 50 basis point hike in May was 97.6% on 4/21/22. Stay tuned!


