View from the Observation Deck
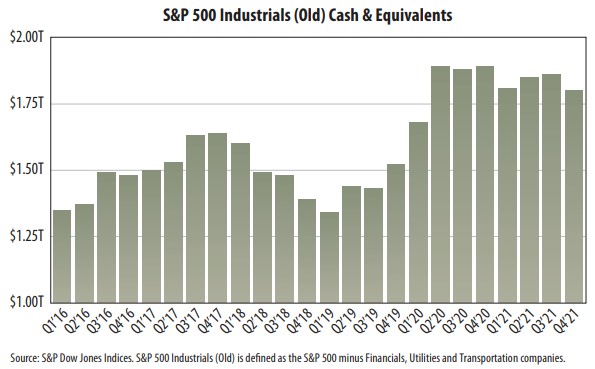
1. In Q4'21, S&P 500 Industrials (Old) cash and equivalents stood at $1.80 trillion (see chart).
2. The all-time high was $1.89 trillion, set in Q4'20.
3. From Q3'09 (not in chart – quarter in which the S&P 500 Index bottomed during the financial crisis) through Q4'21, cash holdings rose from $664.78 billion to
$1.80 trillion, or an increase of 170.77%.
4. The S&P 500 Index posted a cumulative total return of 770.06% (18.00% average annualized total return) over the same period, according to Bloomberg.
5. What is interesting is that S&P 500 Index companies spent $4.720 trillion on stock dividend distributions and $6.833 trillion stock buybacks over that same
period (3/31/09-12/31/21), according to S&P Dow Jones Indices.
6. Keep in mind that S&P 500 companies also utilize the capital for such things as mergers and acquisitions, investment in plants and factories, and purchasing
software and equipment.
7. Seeing S&P 500 Index cash holdings continue to rise over time suggests that America’s largest companies, overall, appear to be on solid footing, in our opinion.


