View from the Observation Deck
1. The old axiom in the stock market about selling your stocks at the close of April and then buying back in at the start of November once made some sense from a seasonality standpoint.
2. When the U.S. was more of an industrialized economy it was not uncommon for plants and factories to close for a month or longer in the summer to retool and allow employees to vacation.
3. The theory was that companies would conduct less commerce in that six-month span, which would likely translate into lower earnings.
4. Today, due in large part to globalization, the world is far more interconnected and competitive, and there is less room for downtime, in our opinion.
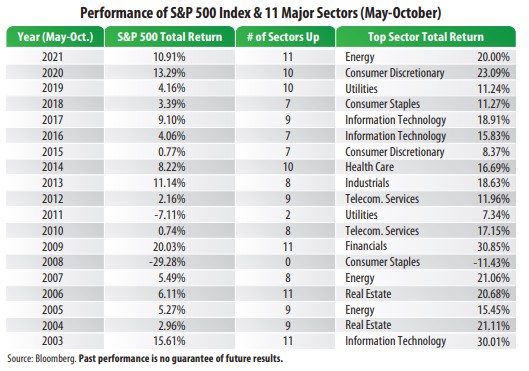
5. From 2003 through 2021, there were just two instances (2008 & 2011) in which the S&P 500 Index posted a negative total return from May through October,
and the 2008 occurrence was during the financial crisis.
6. The average total return for the S&P 500 Index for the May-October periods in the table was 4.58%, which is nothing to run from, in our opinion.
7. Sixteen of the 19 top-performing sectors in the table posted total returns in excess of 10.00% (May-October). For comparative purposes, from 1926-2021 (96 years), the S&P 500 Index posted an average annual total return of 10.46%, according to Ibbotson & Associates/Morningstar.
8. The stock market has been navigating a number of significant headwinds for many months, including the ongoing global battle with COVID-19, supply-chain
disruptions, the war between Russia and Ukraine, the spike in energy prices, surging inflation, and rising interest rates and bond yields. At any given time, it is
easy to conjure up reasons to shun the stock market. The data in the table, however, is a reminder to investors that doing so can potentially come at a steep cost.


