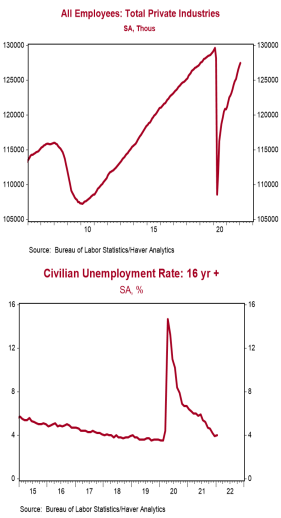
- Nonfarm payrolls increased 467,000 in January, well above the consensus expected 125,000.
- Private sector payrolls rose 444,000 in January. The largest increases in January were for leisure & hospitality (+151,000), professional & business services (+86,000, including temps), and retail (+61,000). Manufacturing rose 13,000 while government increased 23,000.
- The unemployment rate ticked up to 4.0% in January from 3.9% in December.
- Average hourly earnings – cash earnings, excluding irregular bonuses/commissions and fringe benefits – rose 0.7% in January and are up 5.7% versus a year ago. Aggregate hours declined 0.3% in January but are up 3.7% from a year ago.
Implications:
We’re going to cut to the chase: although there were some very strong headlines on the employment situation in January, the report was not nearly as strong as many analysts are making it out to be. Here’s the good news: nonfarm payrolls rose 467,000 in January, blowing away the consensus expected 125,000 and higher than the forecast from any economics group. In addition, payrolls in November/December were revised up a whopping 709,000. Meanwhile, civilian employment, an alternative measure of jobs that includes small-business start-ups, increased 1,199,000 in January. Seemingly bucking Omicron, the labor force (people who are either working or looking for work) rose almost 1.4 million. Workers’ wages also shot up, with average hourly earnings up 0.7% in January and up 5.7% from a year ago. What’s not to like? Well, let’s dig a little deeper! First, the average workweek declined to 34.5 hours in January from 34.7 in December. As a result, in spite of the strong increase in the payrolls, total hours worked fell 0.3% in January. That 0.3% decline is the equivalent of losing about 350,000 jobs for the month. Second, although payrolls were revised up substantially for November/December, that was due to new seasonal adjustment factors generated once a year by the Labor Department; all the extra gains for November/December were simply a shift from June/July. Third, the great civilian employment number – roughly 1.2 million jobs – was also due to a quirk. Every January, the Labor Department inserts new Census data on the size of the US population, which affects the numbers on the labor force and employment. That population adjustment was responsible for all the increase in civilian employment in January; without that quirk, the BLS would have reported a 272,000 drop in civilian employment and a 137,000 decline in the labor force. We’re not suggesting the January employment report was “bad” news; we’re just demonstrating that it doesn’t deserve the exuberance that the headline payroll number suggests. The unemployment rate ticked up to 4.0% in January from 3.9% in December, but that’s still a level that will allow the Federal Reserve room to say they are now focused on inflation. It’s also important to note that although wages are growing quickly, total normal worker pay is close to treading water versus inflation. Average hourly earnings are up a strong 10.7% versus February 2020 (preCOVID). But total hours worked are down 1.3% over that same timeframe, leaving total earnings up 9.3%. That’s good, but we estimate consumer prices are up 8.8% over the same period, which means real earnings are up only 0.5% in almost two years. The labor market has made great progress in the past year but is far from fully healed. Payrolls remain 2.9 million below where they were in February 2020 and we don’t expect to get back to pre-COVID levels until the second half of 2022.


This report was prepared by First Trust Advisors L. P., and reflects the current opinion of the authors. It is based upon sources and data believed to be accurate and reliable. Opinions and forward looking statements expressed are subject to change without notice. This information does not constitute a solicitation or an offer to buy or sell any security.


