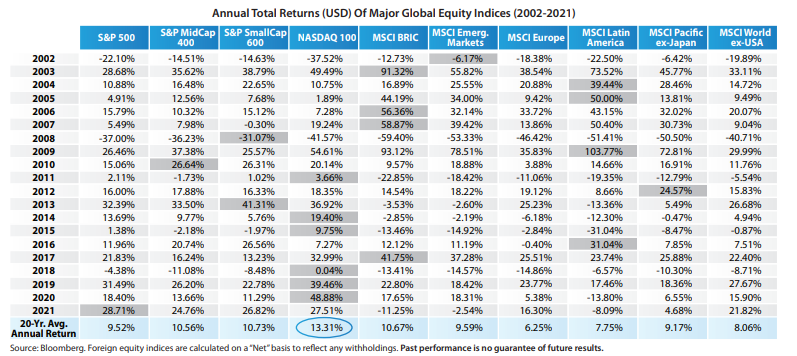
- In 10 of the past 20 calendar years, at least one of the four major U.S. stock indices in the table outperformed all of the major foreign stock indices featured.
- Seven of those years of outperformance occurred in last decade. The NASDAQ 100 Index accounted for five of the seven.
- The top-performer for the 20-year period captured in the table was the NASDAQ 100 Index, with an average annual total return of 13.31%.
- The S&P 500 Index posted an average annual total return of 9.52% for the period, below its 10.46% average generated from 1926-2021 (Morningstar/Ibbotson).
- Emerging market stock indices had a strong showing over the first 10 years, particularly the BRIC countries (Brazil, Russia, India & China) and Latin America.
- Over the first 10 years covered in the table, the U.S. Dollar Index (DXY) plunged by 31.32% (Bloomberg). The weakness in the dollar boosted the returns for U.S. investors owning unhedged foreign stocks. Over the second 10-year period, DXY rose by 19.32%. That gain reduced the returns on unhedged foreign stocks.


