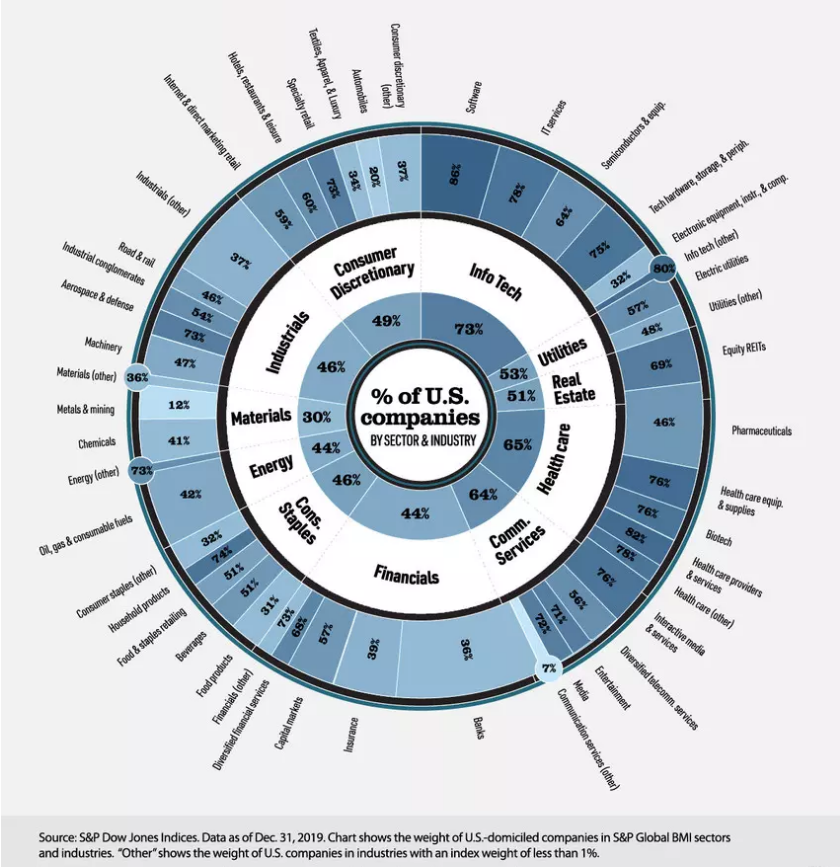
Today’s visualization is based on a concept by S&P Dow Jones Indices that shows the percentage of U.S.-based companies in global sectors and industries as of December 31, 2019. The calculations reflect the market capitalization of companies in the S&P Global Broad Market Index (BMI), an index that tracks over 11,000 stocks across 50 developed and emerging economies.


